The Look
- Features
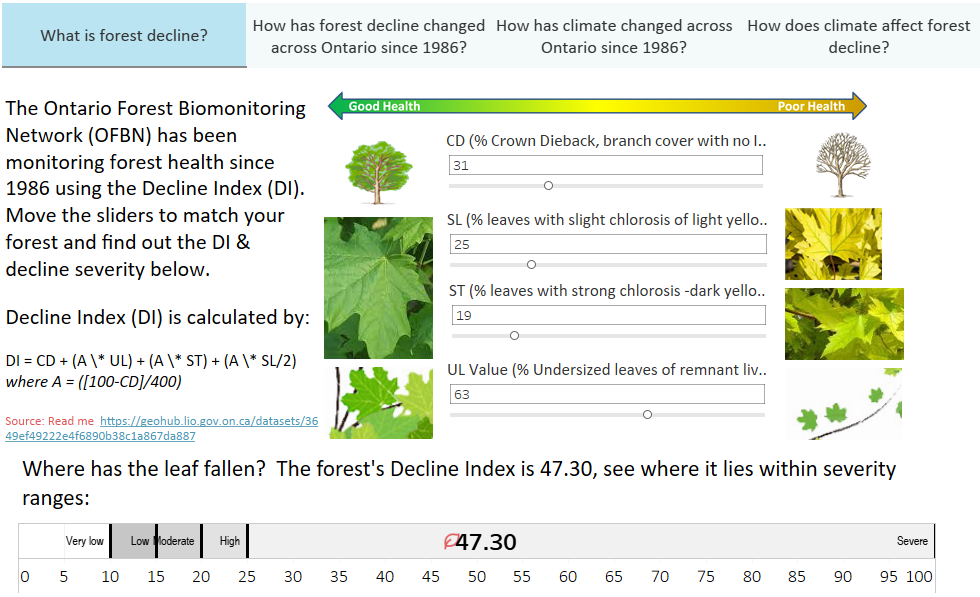
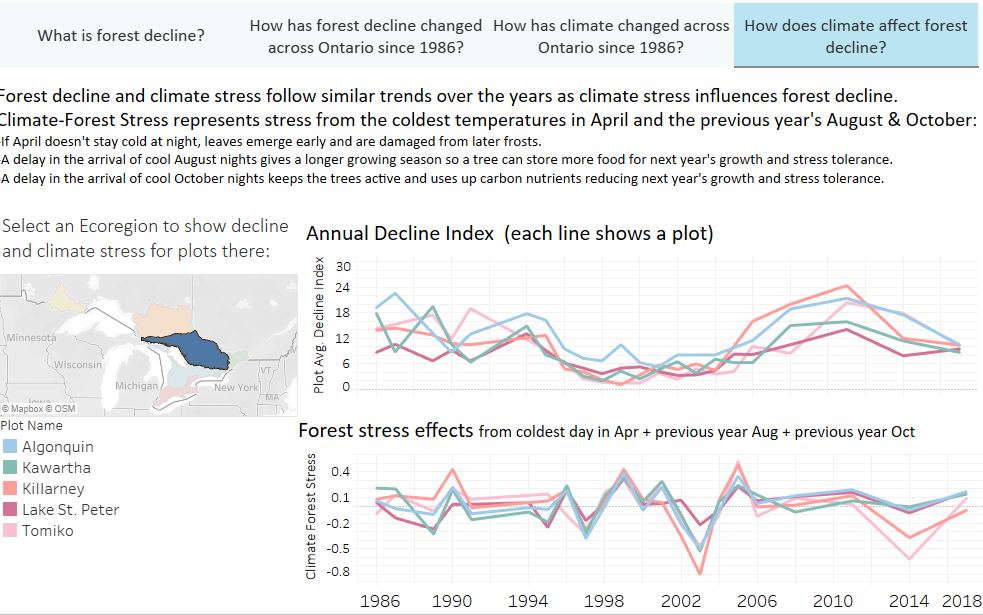
- interactive manipulation of the forest Decline Index formula
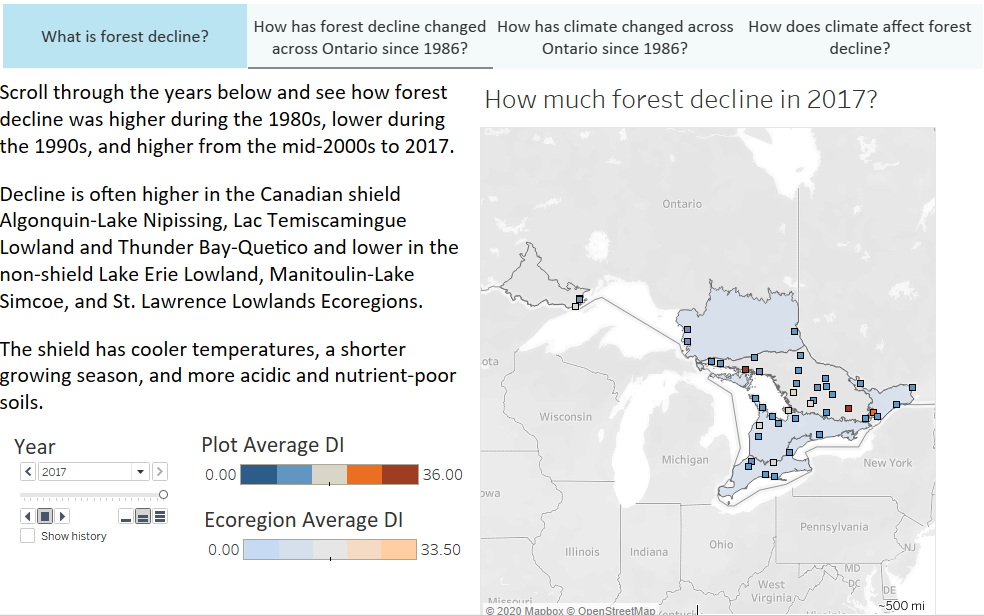
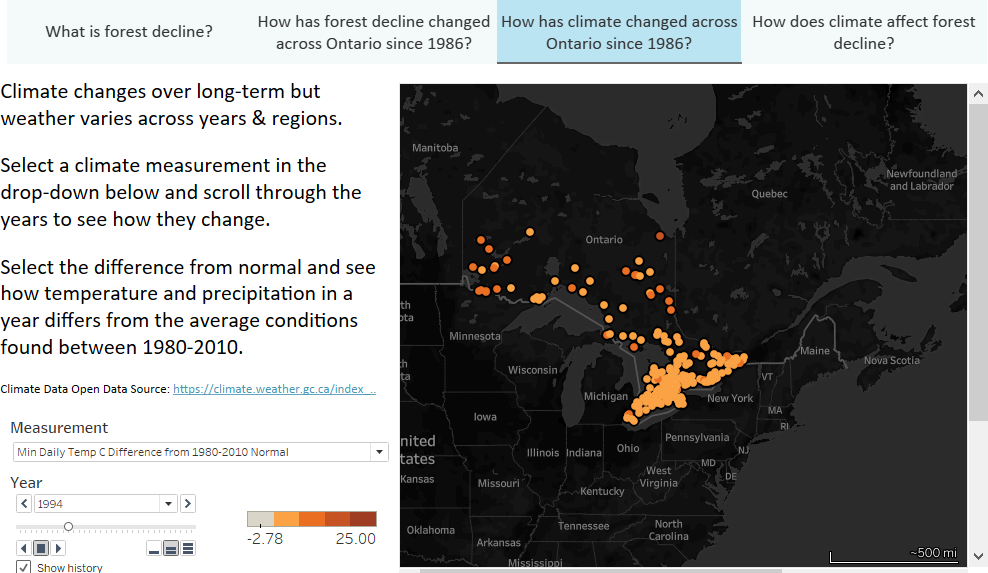
- mapped forest plots and climate stations
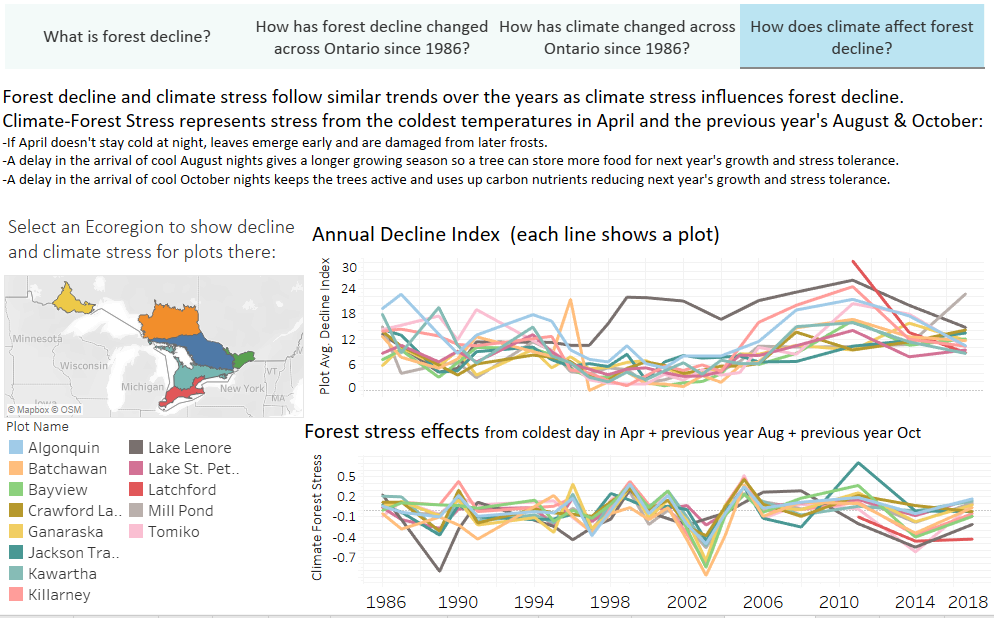
- eco-regional trending References, approach and data pre-processing documentation
- Lessons Learnt (personal opinions)- the platform
- DOA outside of specific server environment (not standalone file), very slow to render
- no provision for collaboration or version control in this version
- needed heavy wrangling outside of software esp. for GIS
- GUI presents a challenge to share/reproduce, requiring animated GIF captures
- a lot of “tricking” the system required, lack of fine control and unclear parsing (overcome by training?)